
Infographics are a handy, better, and informative tool to create exciting content. It is not easy to attract internet traffic to your related subject. The audience becomes fed up with the same material posted by everyone.
The thing that can boost your content marketing is infographics, but important is how to create it. And, it works like a story for an audience.
There are many tools for creating an infographic, but the goal of it remains the same to give an idea about the subject through related information. It will help the user to read the topic easily that you want to say. It is one thing that can create a big difference in the content because people are more attracted to colors, images, or graphics than plain text.
Table of Contents
Benefits To Create Infographics
Infographics have many benefits; some of them are:
- They made the topic appealing, eye-catching, and pleasing.
- They are easy to create, less time-consuming, and affordable.
- It helps the user to scan the information.
- The content with images gets more shares through social media, hence viral faster.
- They simplify complex information.
- Infographics are easy to read, remember, and learn.
- They can boost SEO.
- They add more value to the brand.
- Using infographics, readers’ spent more time on the site. As a result, the conversion rate will increase, and more traffic.
Remember Three Things To Create Infographics
- Do not forget the goal of infographics that will help you to stay on the right path.
- Always take start from storytelling because it will convey the idea step by step.
- Focus on the topic.

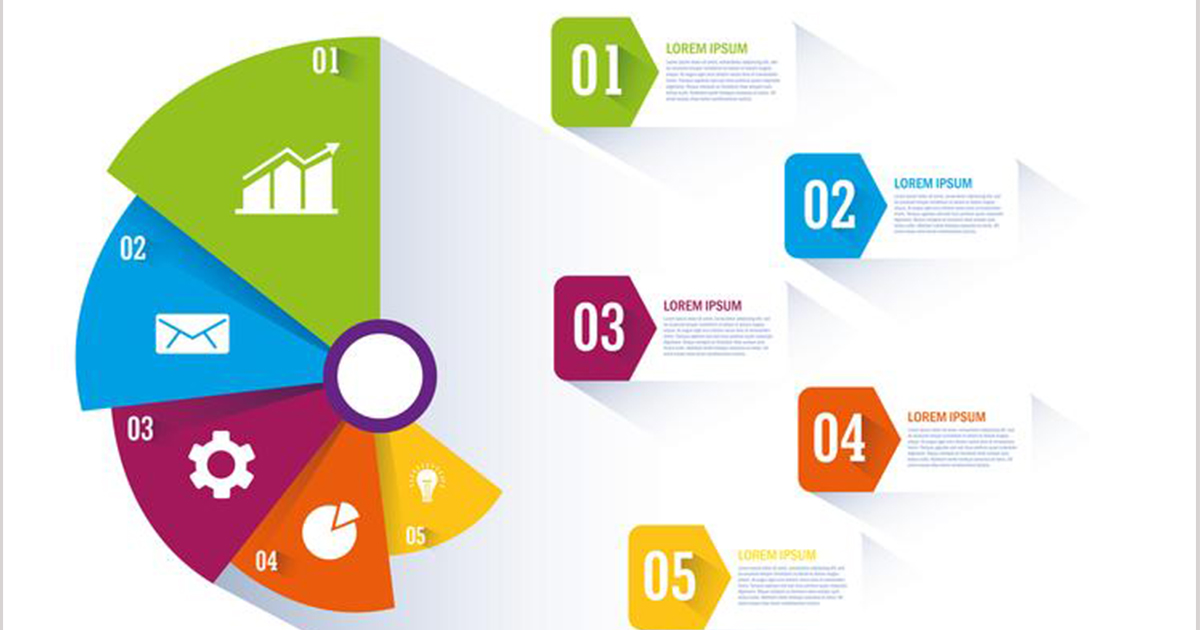
How Infographics Work
An infographic not only helps to get the point quickly, but also it is easy to keep the concept in mind for longer times as it uses the different images to clarify the idea, so it keeps things simple.
1. Targeting The Audience
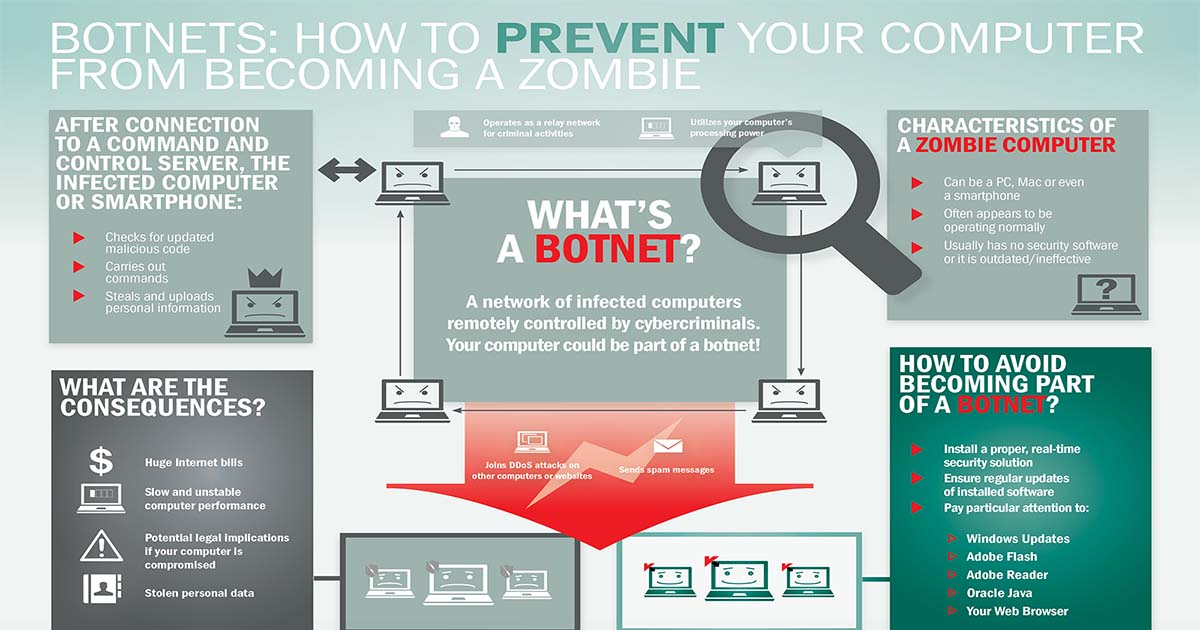
Many things work effectively through infographics. It is one of the easiest ways to grasp the targeted audience and increases the interest of the readers. Humans respond at once to visuals than simple text. Reading the information in text form is difficult when it contains complex data. The brain takes time to process it so that the meaning will be clarified. In contrast to this, images are easy to understand and hit the brain faster.
![]()
2. Attention-Grabbing
The readers come for a short span on the web page only to get an idea or to scan the relevant information. Due to which the readers do not pay attention to other pages, and the data remains unseen. Therefore, infographics help to grab the attention of the readers’. When images are relevant, then it will work more otherwise, no use.
3. Make Information Simple
Infographics are a handy tool in making difficult information into a simpler one that is easy to learn. It presents the main idea. How much it will be precise; it will help the reader to get the point.
4. Engages The Reader
Using infographics in the text increases the readers’ engagement when the message you want to deliver to the audience breaks down into small chunks. And by visual images, it looks appealing and attractive. The reader will take interest to read the concept. As a result, bouncing off will reduce.

5. Easy To Memorize
When you use infographics in the content, it helps to memorize the information more times higher than the text without images and also gives uplift to digital marketing because the things become smooth to get in mind.

The thing is how you create an infographic is not as easy but not trying too. It requires time and research regarding the topic and its related elements.
How To Create Infographics
1. Choose The Topic
It is essential to make a start for a conversation because we can not convey a message without question. So, choosing a topic about what you want to say and what people will learn from it is necessary. Moreover, this thing will also help to stay on the right way, and others will quickly know what the main point is.

2. Collect The Data
Once done with the topic, next comes collecting the data that describes the goal of the question, what you need to answer. Once you have done, this will help you to focus on the main point.

3. Choose The Infographics
Infographics include charts, graphs, images. It depends on you to select the infographic design that best suits your need. You can use pre-made templates or also design new infographics using tools.
4. Promote The Infographics
Before the promotion, always do a checklist from start to end because it will help to avoid side issues. After that, share the infographics on social media because it is one of the best-sharing media than others where things viral faster. It is an easy way and will bring more backlinks, the fundamental purpose of the SEO.

Frequently Asked Questions
1. What is the objective of using infographics?
The primary objective of infographics is to simplify the information so that it will be easy for the readers to get the point you want to put in front of them. It will also increase interests and keep the readers on the page.
2. What are the essential elements of infographics?
- Title and subheadings: Helps the user to look at what they want.
- Bold color scheme: Always select the color scheme that goes with your message.
- Informative statistics: Always add relevantly, correct and accurate statistics.
- Attention-grabbing graphics: Besides other things, it should grab the attention of the readers.
- Storytelling: It must tell the information like a story to absorb it.
3. Is infographic effective in conveying a message?
Yes, a compelling infographic has some attributes. It works as a story that is easy to understand and designs well to give visual impact to the content.
4. What should be the size of the infographic?
The size of the ideal infographic should have a width of 600pixel and a length of 1800pixel. The size of the vertical infographics lies between 600-1100 wide, while for shorter height is above 2000pixels.
5. Which type of infographics mostly used?
The best type is Timeline infographic to describe the history, highlighting dates, or for an overview of an event.


 & Passion.